
WHAT IS BUILD REVIEW
STEPS
- CHECK IPV6 STATUS
- REASON: Applications are built to favour dual stack (IPV4 and IPV6) because IPV4 is slowly running out. Enabling IPV6 guarantees proper running of application on your operating system.
Enter the command below in your ubuntu 22.4 terminal to Check
  grep -Pqs '^\h*0\b' /sys/module/ipv6/parameters/disable && echo -e "\n -
IPv6 is enabled\n" || echo -e "\n - IPv6 is not enabled\n"
NOTE: In this example is used to monitor host on the subnet 192.168.200.0/24 Ensure to use the right ip address for yours. Thanks.
DOWNLOAD AND INSTALL ZABBIX SERVER
-
DOWNLOAD THE ZABBIX SERVER FROM HERE
-
Install and run the virtual machine
CONFIGURE THE ZABBIX SERVER
sudo nano /etc/netplan/00-installer-config.yaml

EDIT THE FOLLOWING CONFIGURATION TO INCLUDE YOUR
network:
  ethernets:
    enp0s3:
      addresses:
      - 192.168.200.2/24
      nameservers:
        addresses:[]
        search:[]
     enp0s8:
       dhcp4: true
   version: 2
SAVE YOUR CONFIGURATION
Press ctr x
type y
press enter
sudo netplan apply
sudo systemctl restart networking
ACCESS THE ZABBIX GUI
Enter the configured ip address into your web browser
http://192.168.200.6/zabbix
ENTER LOGIN CREDENTIALS
username: Admin
password: zabbix
DOWNLOAD AND INSTALL ZABBIX-AGENT ON THE HOST MACHINE
sudo apt update
sudo apt install zabbix-agent
CONFIGURE ZABBIX AGENT
sudo nano /etc/zabbix/zabbix_agentd.conf

NAVIGATE TO THE SERVER AND EDIT THE SERVER IP TO YOUR ZABBIX SERVER IP
NAVIGATE TO SERVER ACTIVE AND EDIT THE IP TO YOUR ZABBIX SERVER IP
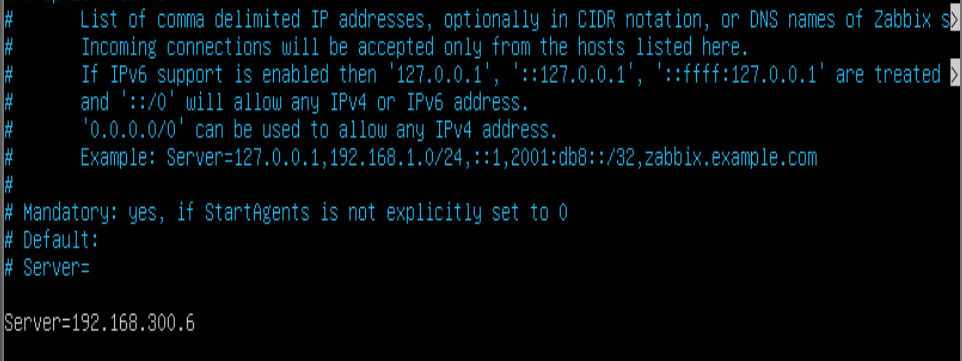
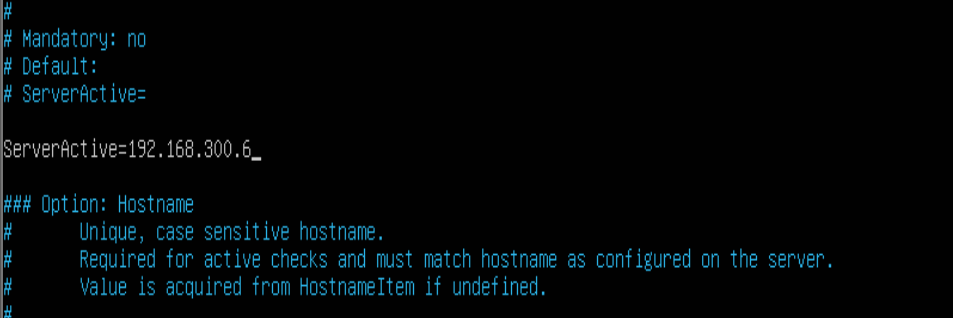
NOTE: The IP address should be the new one you assigned to your Zabbix server above.
SAVE YOUR CONFIGURATION
Press ctr x
Press y
Press Enter
sudo systemctl restart zabbix-agent
sudo systemctl enable zabbix-agent
CONFIGURE NETWORK DISCOVERY
On the Zabbix GUI click on Configuration>Discovery
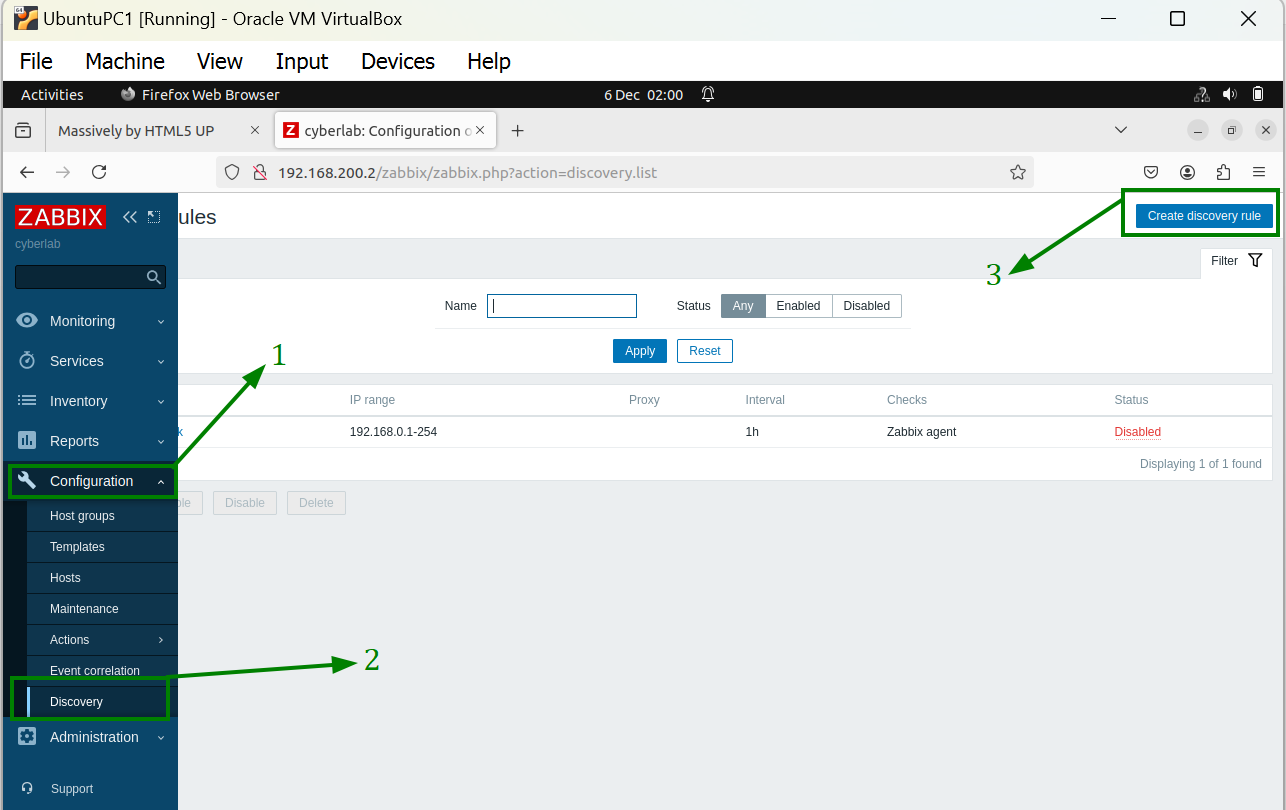
Name: Subnet you want to monitor (192.168.200.0 in this case)
IP Range: 192.168.200.0-255
Update Interval: 1h
Checking: click Add and select ICMP Ping.
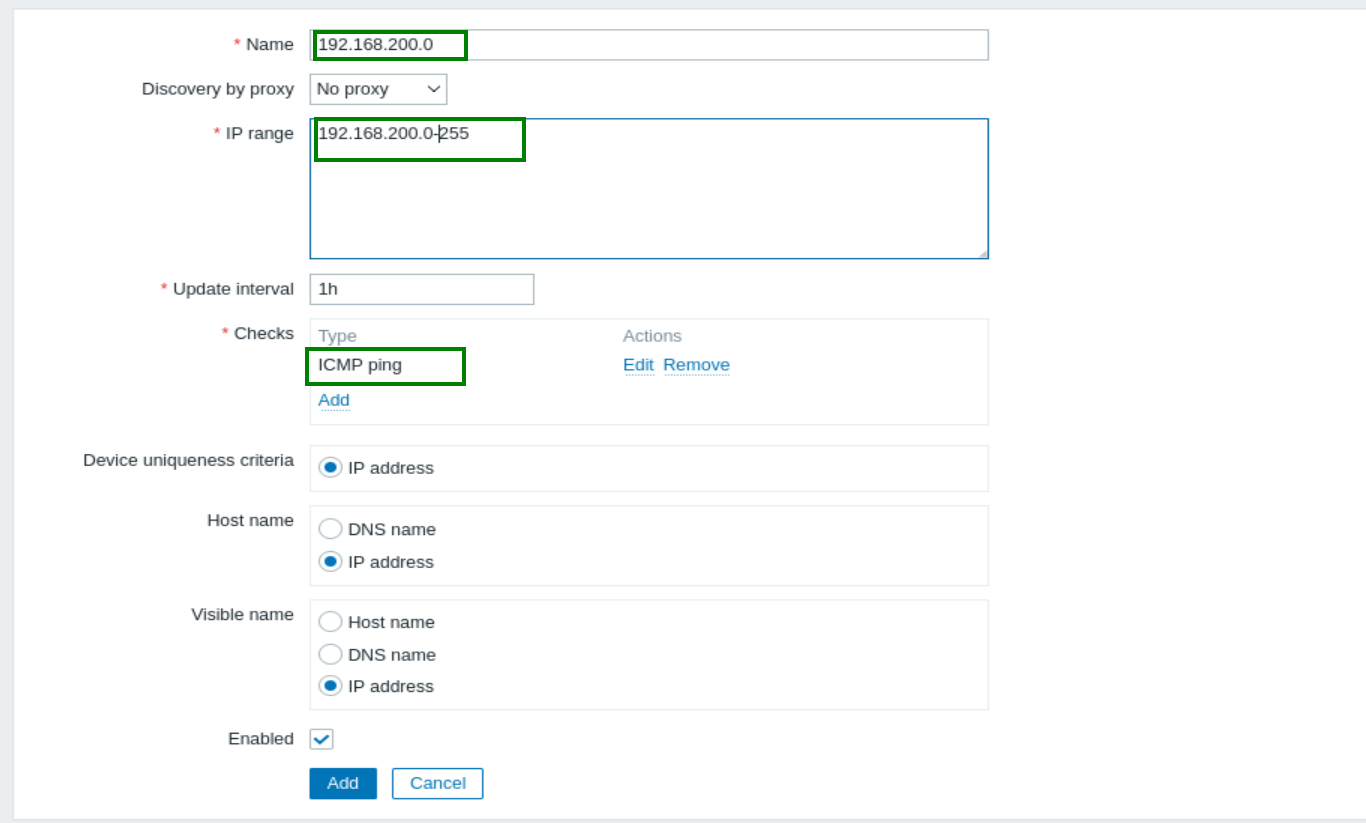
CONFIGURATION CONFIRMATION

HOST DISCOVERY SETUP
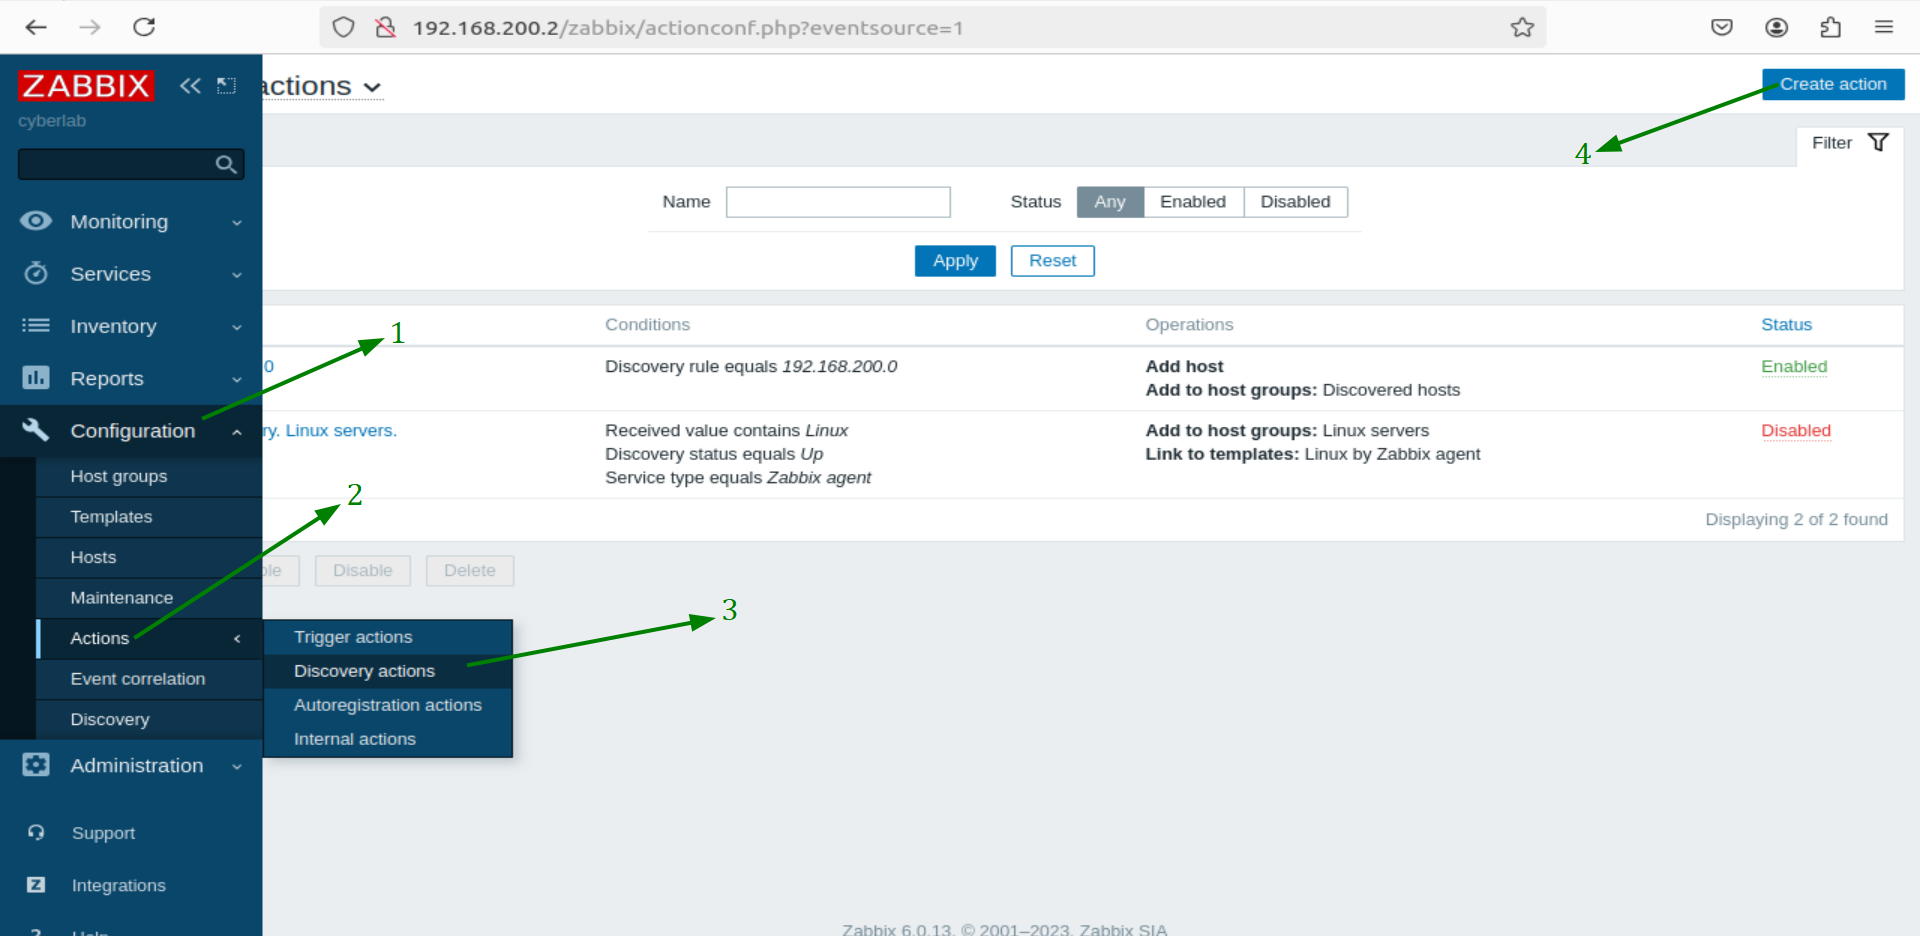
Click on Configuration
Click on Actions
Click on Discovery Actions
Click Create action
click on Action
Name : 192.168.200.0
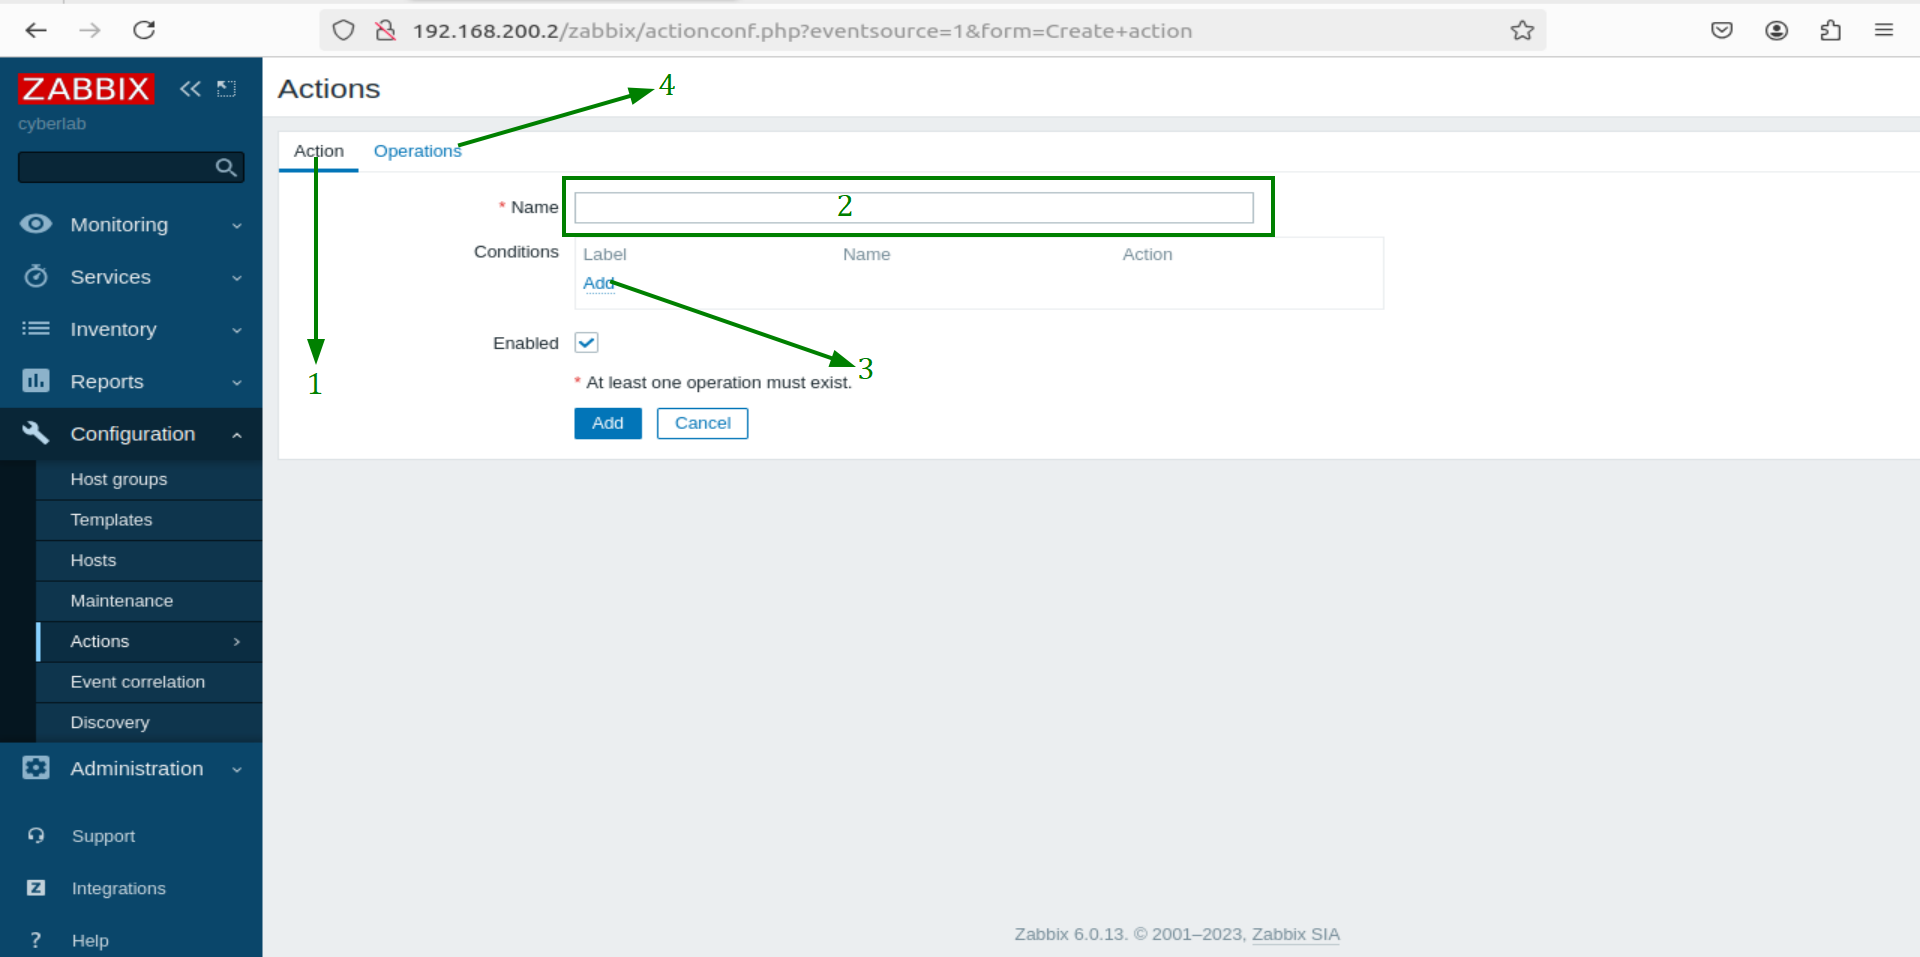
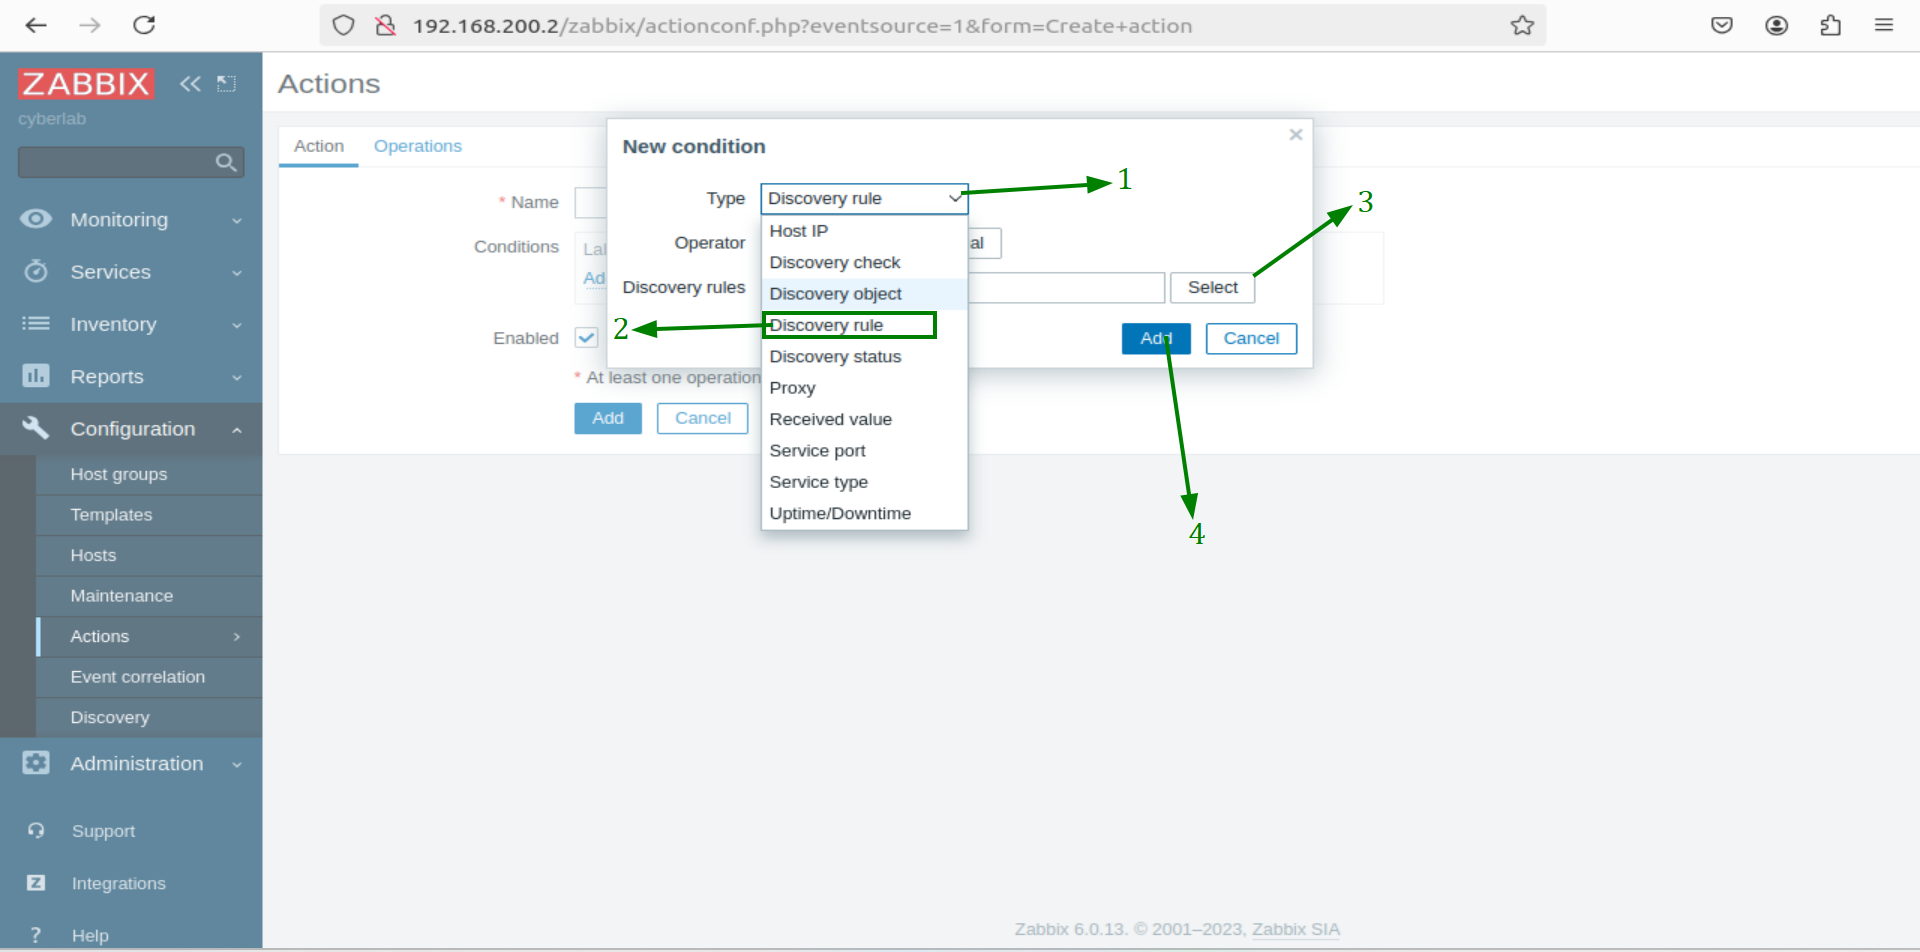
Conditions setup
Click Type
select discovery rule
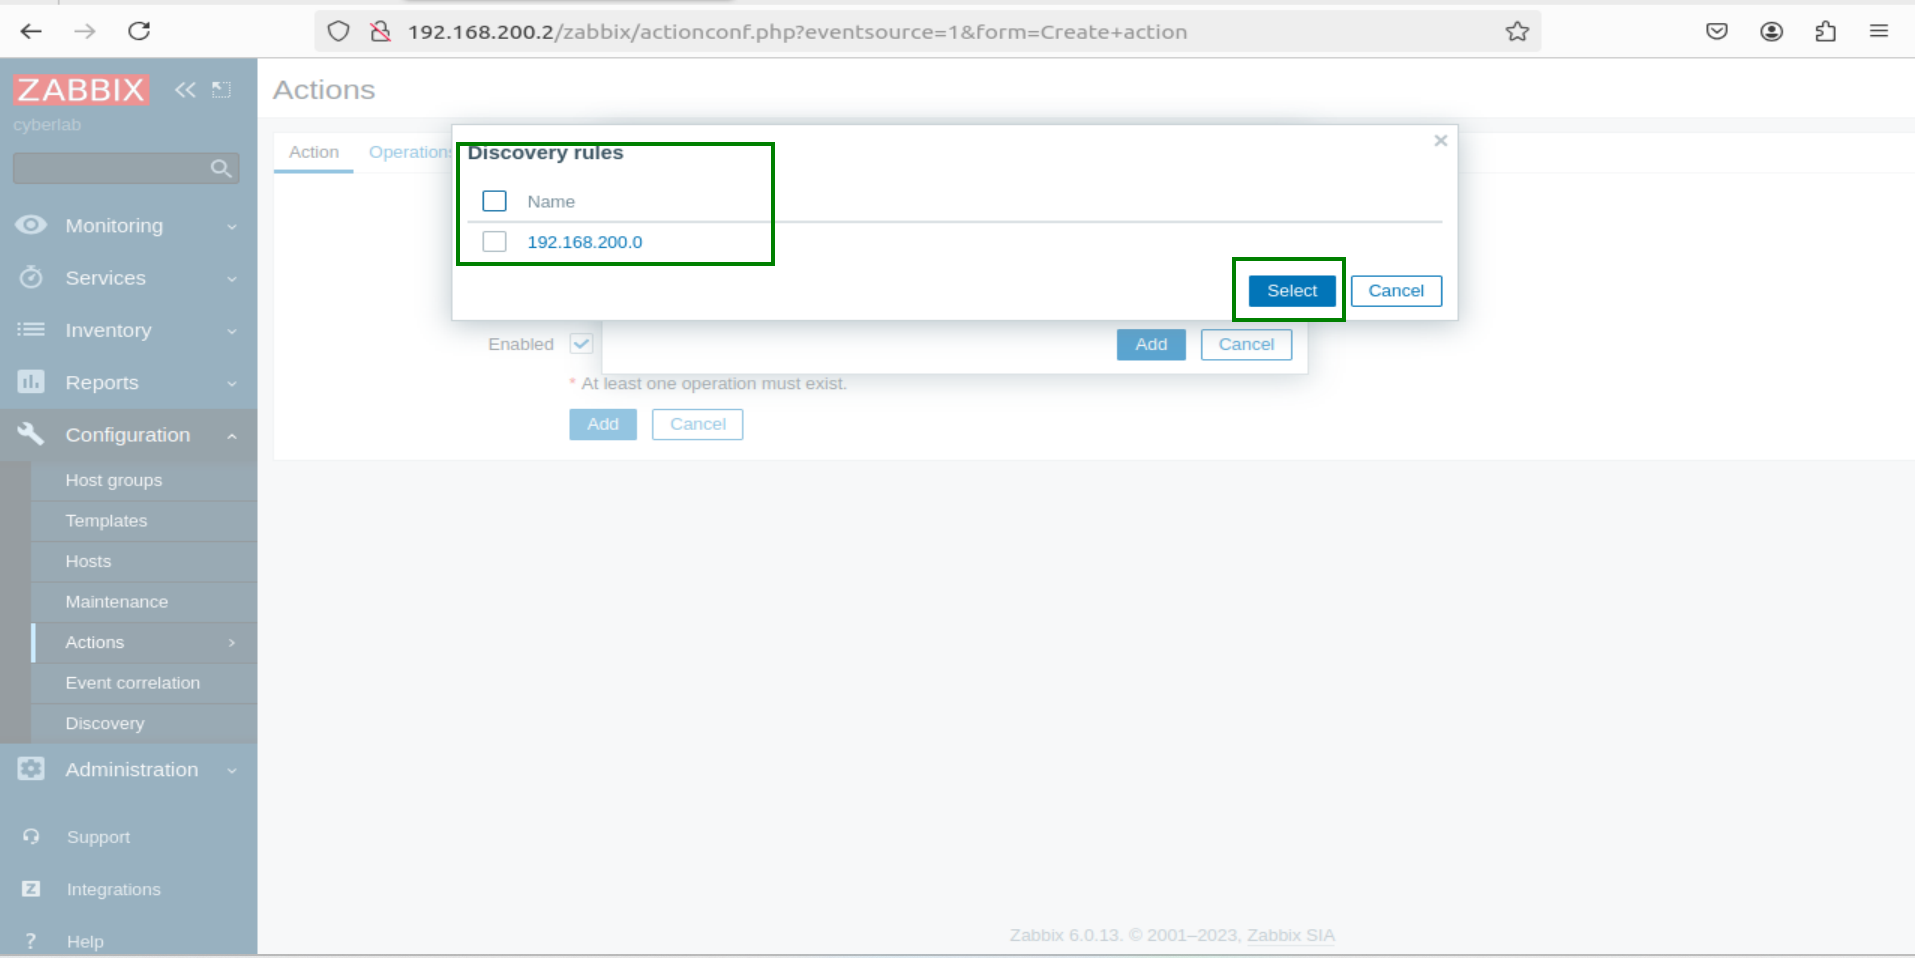
Pick a discovery rule
In front of the discovery rule, click Select
select the previously created discovery rule.
Set Discovery Operations
Click Operations
In the Operation details popup
Click "operation"
select "Add host"
Select "Add" in the new pop-up.
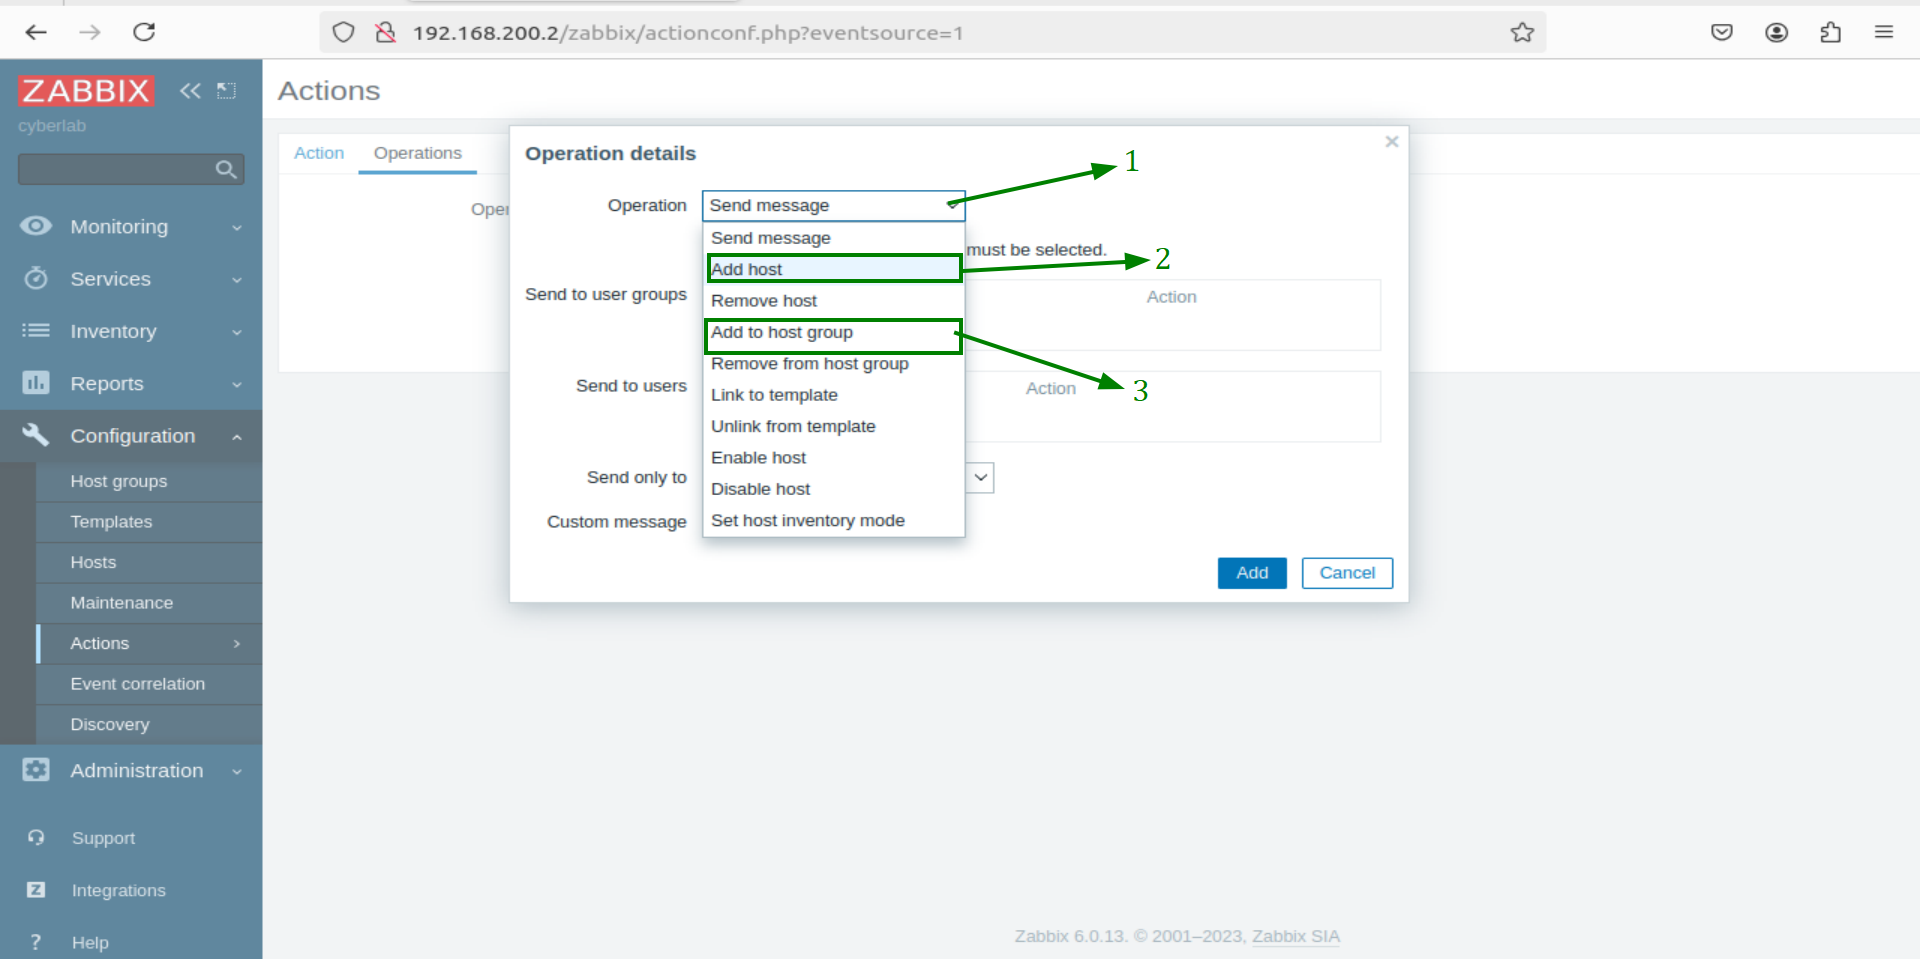
Click "operation" again
Select "Add to host group"
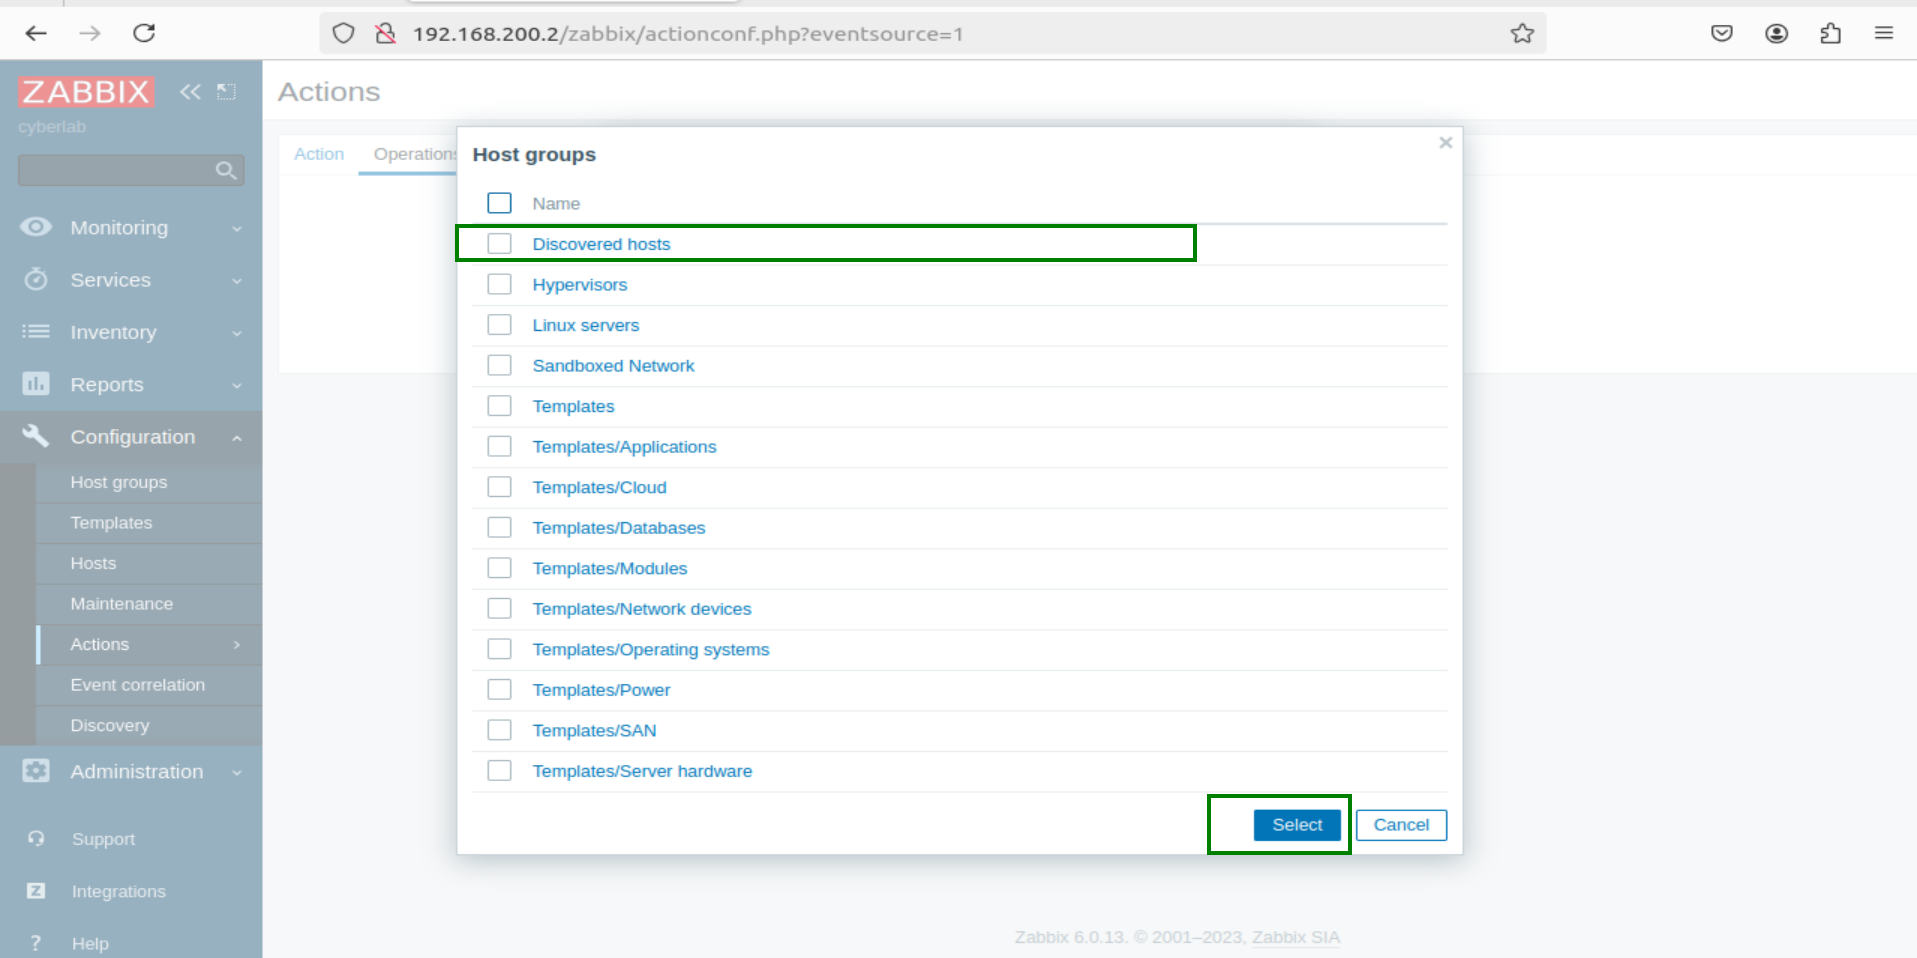
Click "Select" in front of Host groups
Select "discovered" host from the dropdown
TEMPLATE SETUP
Click on Configuration
click on Hosts
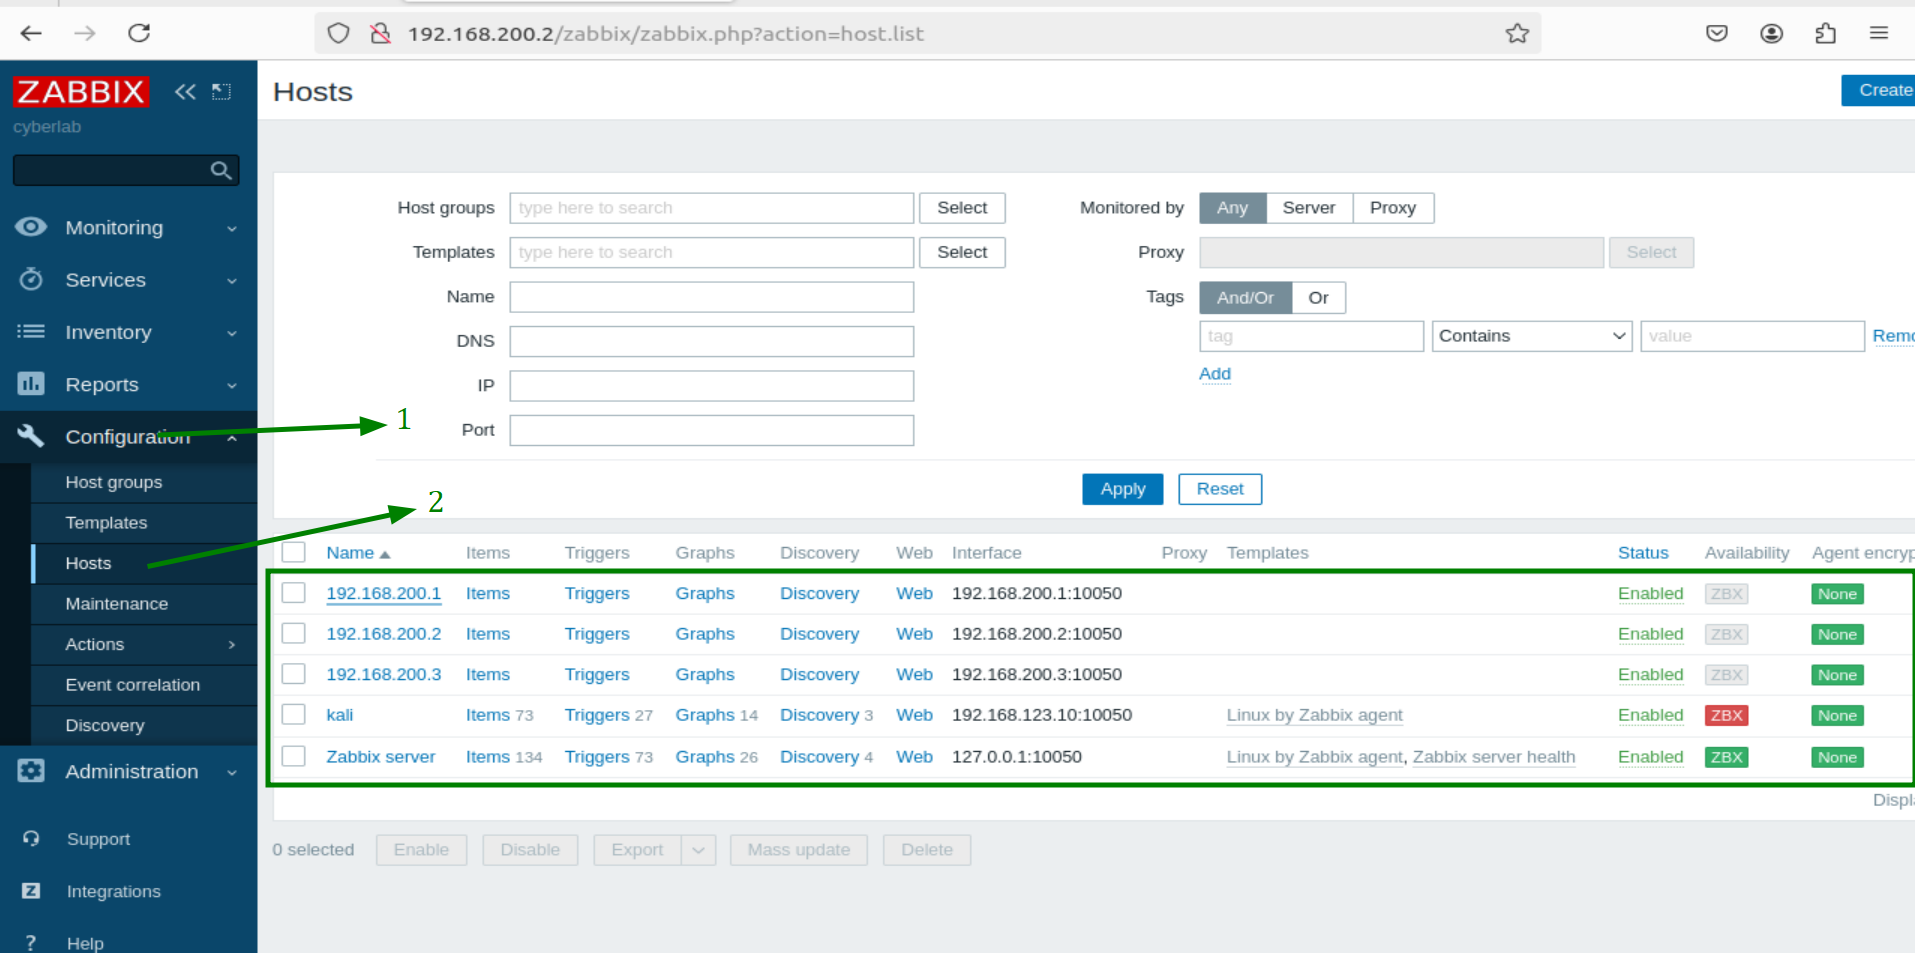
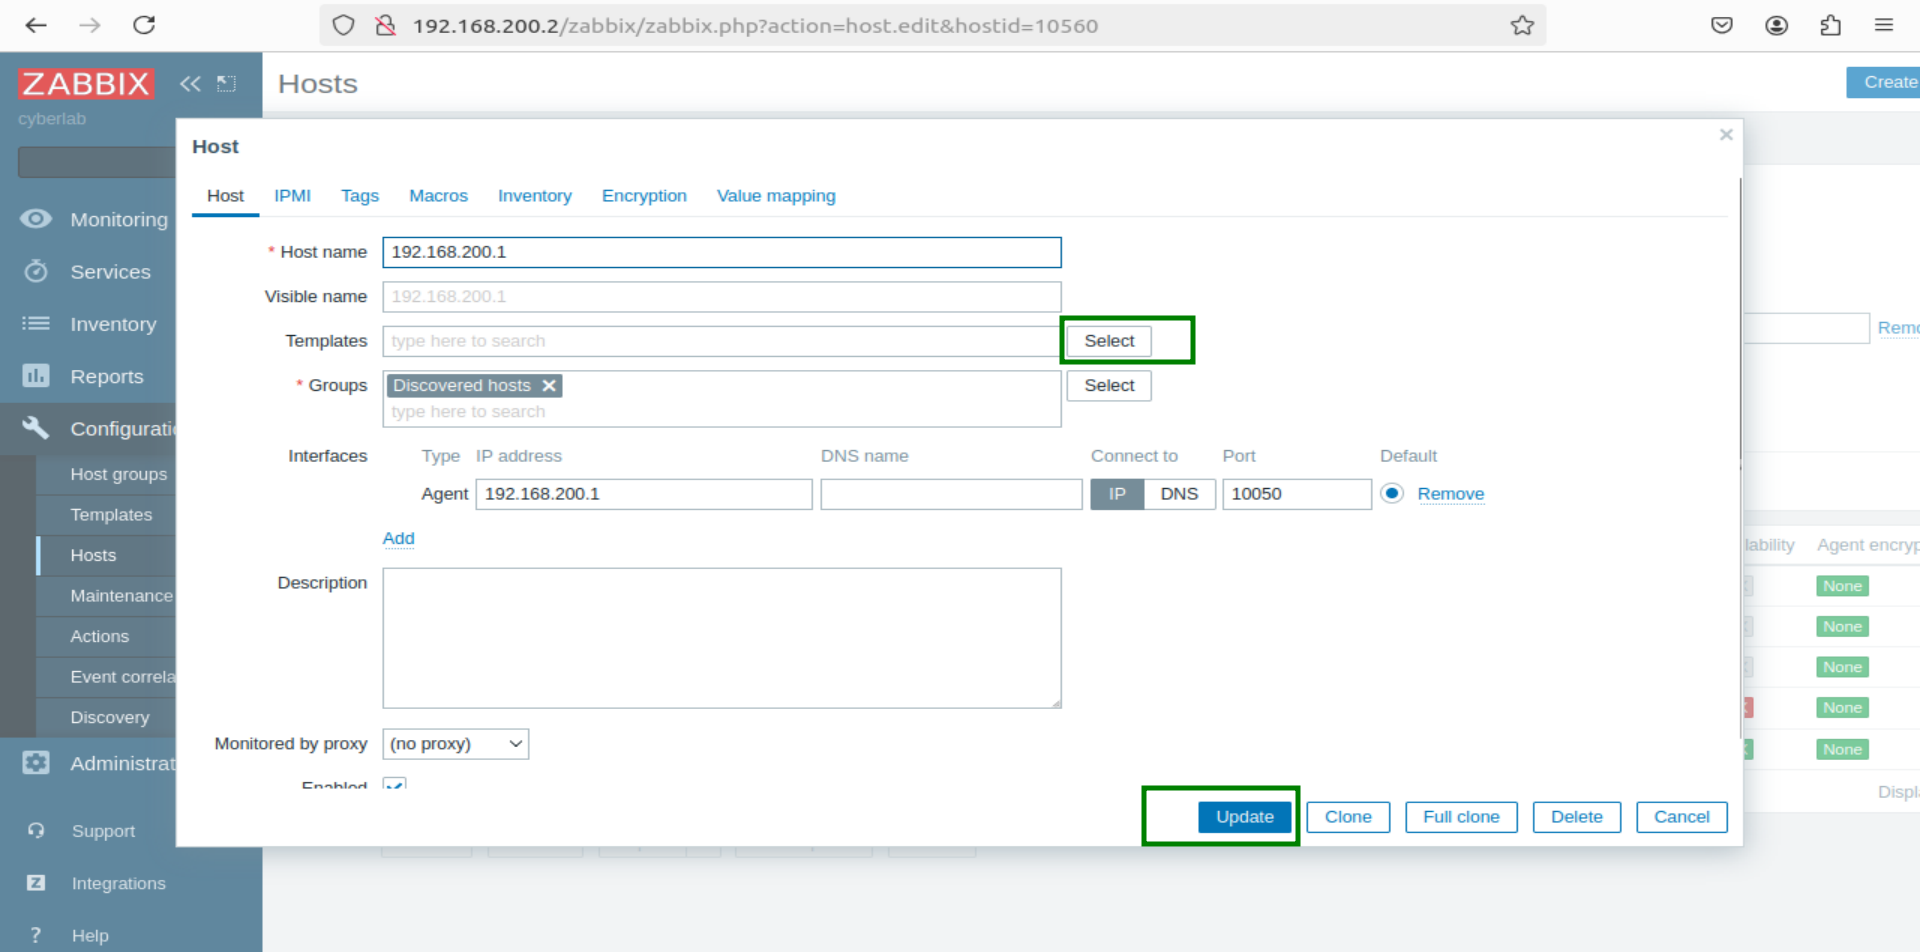
Select host to add template
On the pop-up dashboard, click select in front of templates to pick a template of your choice.
CONFIRM AGENTS ACTIVITIES
Click "on Monitoring"
Click "Latest Data"
Check to confirm the host is getting updated data.
DASHBOARD CUSTOMIZATION
Click on "Monitoring"
Click on "Dashboard"
Click on "All dashboard"
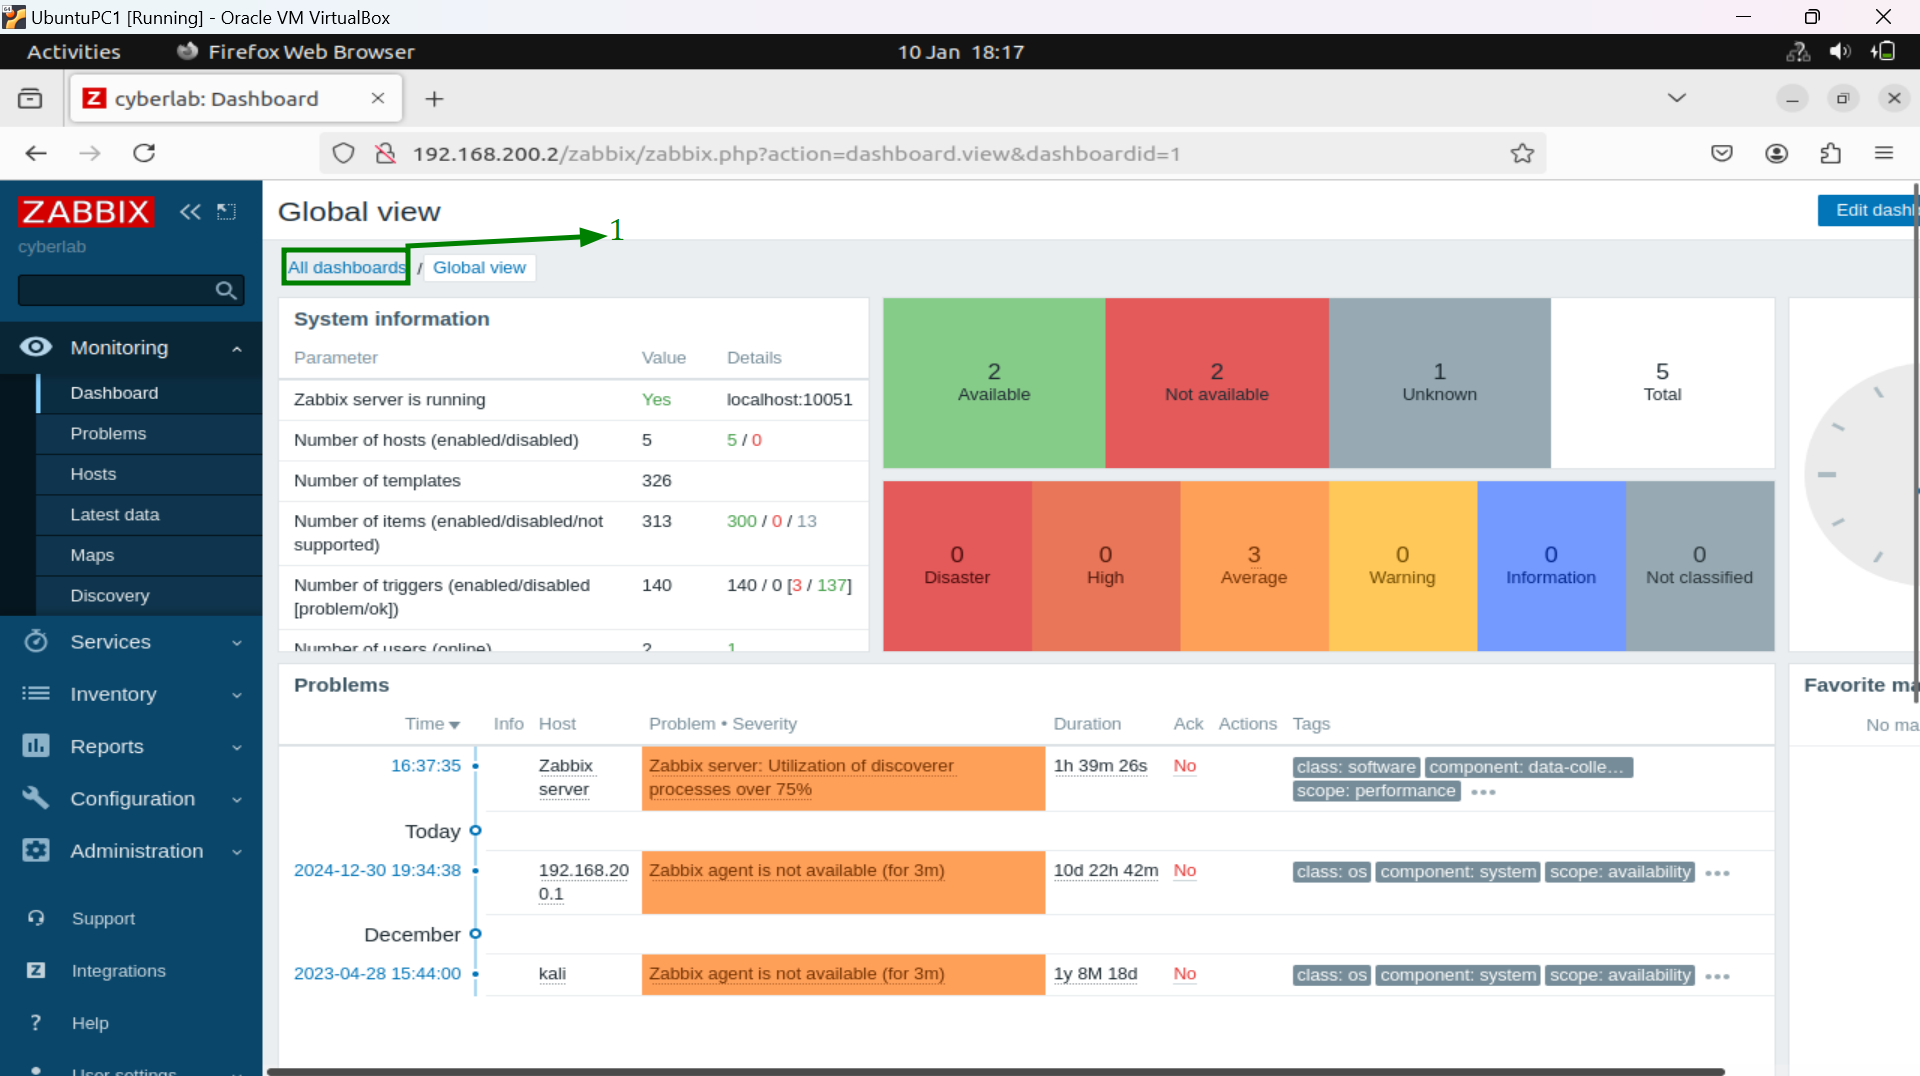
Click on "create dashboard"
Enter the dashboard name
Click Apply
A BLANK DASHBOARD WILL APPEAR. Click on “add” on the right corner to add a widget or click on the dashboard empty space to do so.
NOW YOU CAN CUSTOMIZE THE DASHBOARD TO YOUR TASTE!
HAVE FUN
 Setting Up a Windows10 Virtual Machine